Reading view

There are new articles available, click to refresh the page.

A how-to for ethical geoengineering research

Over the Northern Hemisphere's summer, the world's temperatures hovered near 1.5° C above pre-industrial temperatures, and the catastrophic weather events that ensued provided a preview of what might be expected to be the new normal before mid-century. And the warming won't stop there; our current emissions trajectory is such that we will double that temperature increase by the time the century is out and continue beyond its end.

This frightening trajectory and its results have led many people to argue that some form of geoengineering is necessary. If we know the effects of that much warming will be catastrophic, why not try canceling some of it out? Unfortunately, the list of "why nots" includes the fact that we don't know how well some of these techniques work or fully understand their unintended consequences. This means more research is required before we put them into practice.

But how do we do that research if there's the risk of unintended consequences? To help guide the process, the American Geophysical Union (AGU) has just released guidelines for ensuring that geoengineering research is conducted ethically.


Read full article

Comments

© Handout / Getty Images

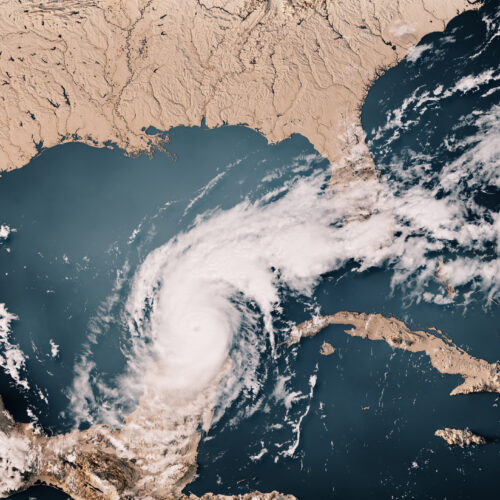
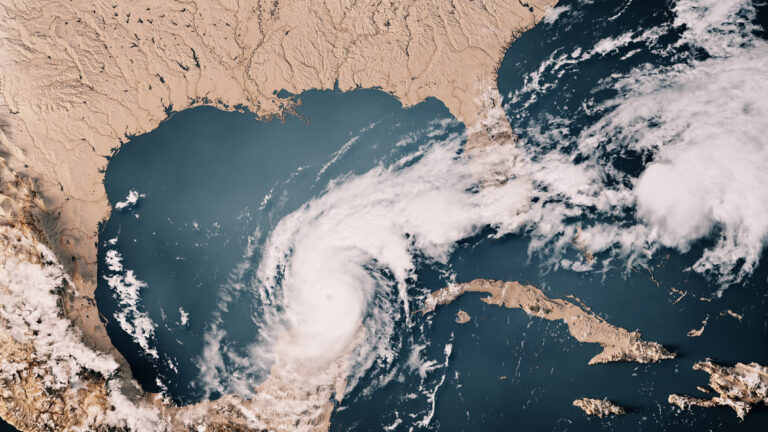
Climate change boosted Milton’s landfall strength from Category 2 to 3

As attempts to clean up after Hurricane Milton are beginning, scientists at the World Weather Attribution project have taken a quick look at whether climate change contributed to its destructive power. While the analysis is limited by the fact that not all the meteorological data is even available yet, by several measures, climate change made aspects of Milton significantly more likely.

This isn't a huge surprise, given that Milton traveled across the same exceptionally warm Gulf of Mexico that Helene had recently transited. But the analysis does produce one striking result: Milton would have been a Category 2 storm at landfall if climate change weren't boosting its strength.

From the oceans to the skies

Hurricanes strengthen while over warm ocean waters, and climate change has been slowly cranking up the heat content of the oceans. But it's important to recognize that the slow warming is an average, and that can include some localized extreme events. This year has seen lots of ocean temperature records set in the Atlantic basin, and that seems to be true in the Gulf of Mexico as well. The researchers note that a different rapid analysis released earlier this week showed that the ocean temperatures—which had boosted Milton to a Category 5 storm during its time in the Gulf—were between 400 and 800 times more likely to exist thanks to climate change.

Read full article

Comments

© Frank Ramspott

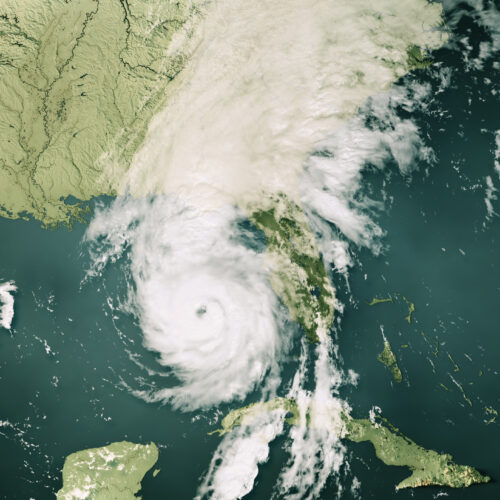
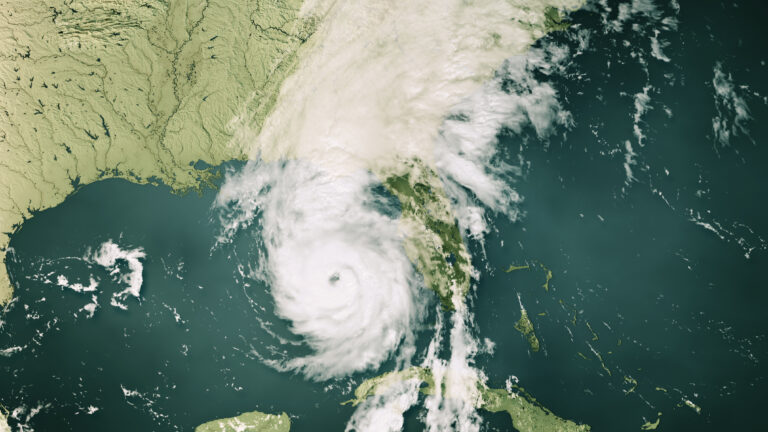
Rapid analysis finds climate change’s fingerprint on Hurricane Helene

Hurricane Helene crossed the Gulf of Mexico at a time when sea surface temperatures were at record highs and then barreled into a region where heavy rains had left the ground saturated. The result was historic, catastrophic flooding.

One key question is how soon we might expect history to repeat itself. Our rapidly warming planet has tilted the odds in favor of some extreme weather events in a way that means we can expect some events that had been extremely rare to start occurring with some regularity. Our first stab at understanding climate change's influence on Helene was released on Wednesday, and it suggests that rainfall of the sort experienced by the Carolinas may now be a once-in-70-year event, which could have implications for how we rebuild some of the communities shattered by the rain.

Rapid attribution

The quick analysis was done by the World Weather Attribution project, which has developed peer-reviewed methods of looking for the fingerprints of climate change in major weather events. In general, this involves identifying the key weather patterns that produced the event and then exploring their frequency using climate models run with and without the carbon dioxide we've added to the atmosphere.

Read full article

Comments

© Frank Ramspott

A record of the Earth’s temperature covering half a billion years

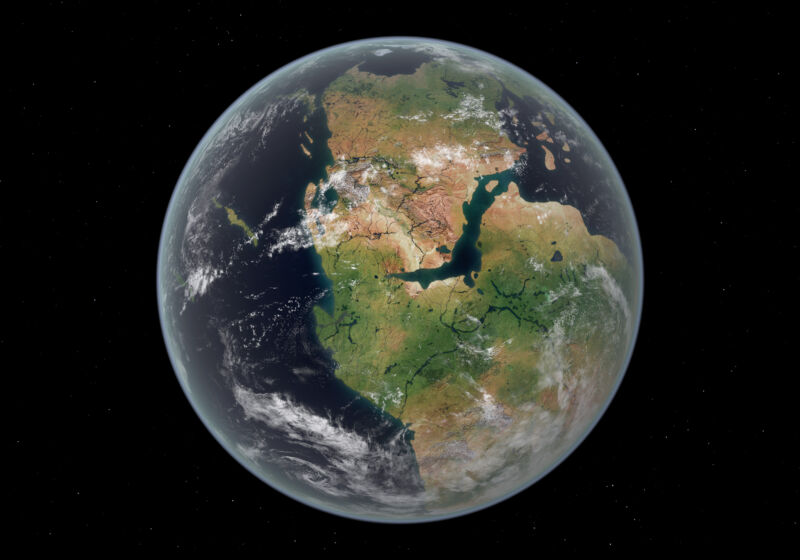
Image of the Earth with a single, enormous land mass composed of several present-day continents.

Enlarge / The cycle of building and breaking up of supercontinents seems to drive long-term climate trends. (credit: Walter Myers/Stocktrek Images)

Global temperature records go back less than two centuries. But that doesn't mean we have no idea what the world was doing before we started building thermometers. There are various things—tree rings, isotope ratios, and more—that register temperatures in the past. Using these temperature proxies, we've managed to reconstruct thousands of years of our planet's climate.

But going back further is difficult. Fewer proxies get preserved over longer times, and samples get rarer. By the time we go back past a million years, it's difficult to find enough proxies from around the globe and the same time period to reconstruct a global temperature. There are a few exceptions, like the Paleocene-Eocene Thermal Maximum (PETM), a burst of sudden warming about 55 million years ago, but few events that old are nearly as well understood.

Now, researchers have used a combination of proxy records and climate models to reconstruct the Earth's climate for the last half-billion years, providing a global record of temperatures stretching all the way back to near the Cambrian explosion of complex life. The record shows that, with one apparent exception, carbon dioxide and global temperatures have been tightly linked. Which is somewhat surprising, given the other changes the Earth has experienced over this time.

Read 13 remaining paragraphs | Comments

How did volcanism trigger climate change before the eruptions started?

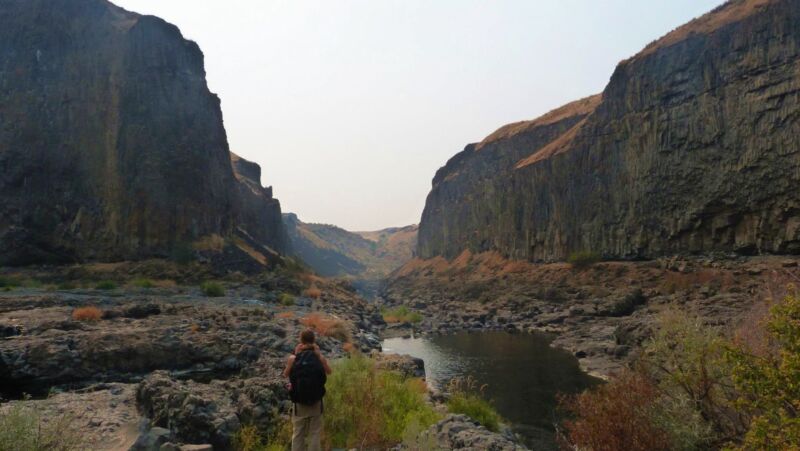
Image of a person in a stream-filled gap between two tall rock faces.

Enlarge / Loads of lava: Kasbohm with a few solidified lava flows of the Columbia River Basalts. (credit: Joshua Murray)

As our climate warms beyond its historical range, scientists increasingly need to study climates deeper in the planet’s past to get information about our future. One object of study is a warming event known as the Miocene Climate Optimum (MCO) from about 17 to 15 million years ago. It coincided with floods of basalt lava that covered a large area of the Northwestern US, creating what are called the “Columbia River Basalts.” This timing suggests that volcanic CO2 was the cause of the warming.

Those eruptions were the most recent example of a “Large Igneous Province,” a phenomenon that has repeatedly triggered climate upheavals and mass extinctions throughout Earth’s past. The Miocene version was relatively benign; it saw CO2 levels and global temperatures rise, causing ecosystem changes and significant melting of Antarctic ice, but didn’t trigger a mass extinction.

A paper just published in Geology, led by Jennifer Kasbohm of the Carnegie Science’s Earth and Planets Laboratory, upends the idea that the eruptions triggered the warming while still blaming them for the peak climate warmth.

Read 32 remaining paragraphs | Comments

Massive underwater eruption may preview deep-sea mining destruction 

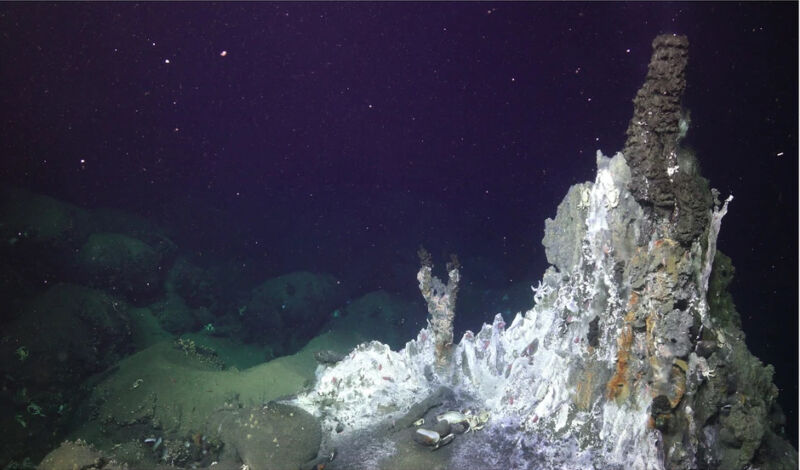
Image of an undersea vent, with lots of white material on one side of the vent, and grey sediment surrounding it. No animals are visible.

Enlarge / Following the 2022 Hunga volcano eruption, a nearby hydrothermal vent was seen coated with a white mat of bacteria and surrounded by a thick layer of ash. The vent usually supports animal life that survives using chemical energy from the vent fluid, but those creatures were almost entirely wiped out. (credit: Beinart, et. al.)

In January 2022, a placid patch of the ocean’s surface near the islands of Tonga suddenly exploded with activity. After a month or so of activity, an underwater eruption of unprecedented scale from the Hunga volcano blasted ash up through the water column and more than 30 miles into the air, where it quickly spread out in a billowing plume spanning hundreds of miles.

The blast was so powerful that it rang Earth like a bell; it produced a shockwave that circled the globe multiple times and released a sonic boom heard as far away as Alaska. The eruption also triggered a tsunami that affected coastlines across the Pacific Ocean and made waves recorded in Japan, North and South America, and Antarctica.

Quite by surprise, scientists discovered that the eruption also had an underwater aftermath, recently described in a paper published in the journal Nature Communications Earth and Environment.

Read 22 remaining paragraphs | Comments

String of record hot months came to an end in July

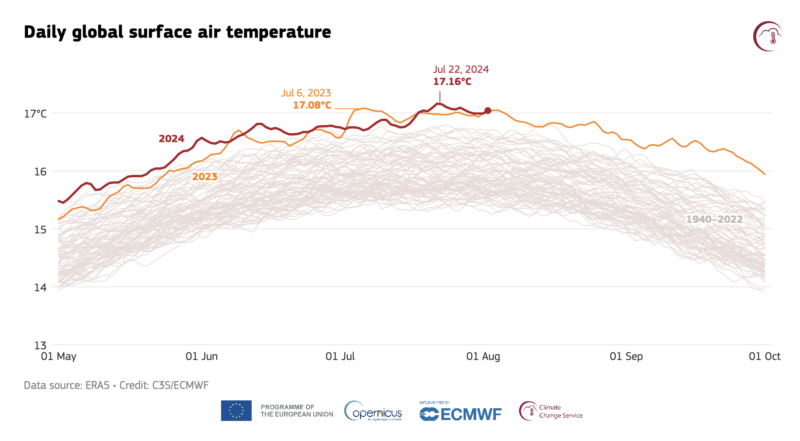
Image of a chart with many dull grey squiggly lines running left to right, with an orange and red line significantly above the rest.

Enlarge / Absolute temperatures show how similar July 2023 and 2024 were. (credit: C3S/ECMWF)

The past several years have been absolute scorchers, with 2023 being the warmest year ever recorded. And things did not slow down in 2024. As a result, we entered a stretch where every month set a new record as the warmest iteration of that month that we've ever recorded. Last month, that pattern stretched out for a full 12 months, as June of 2024 once again became the warmest June ever recorded. But, despite some exceptional temperatures in July, it fell just short of last July's monthly temperature record, bringing the streak to a close.

Europe's Copernicus system was first to announce that July of 2024 was ever so slightly cooler than July of 2023, missing out on setting a new record by just 0.04° C. So far, none of the other major climate trackers, such as Berkeley Earth or NASA GISS, have come out with data for July. These each have slightly different approaches to tracking temperatures, and, with a margin that small, it's possible we'll see one of them register last month as warmer or statistically indistinguishable.

How exceptional are the temperatures of the last few years? The EU averaged every July from 1991 to 2020—a period well after climate change had warmed the planet significantly—and July of 2024 was still 0.68° C above that average.

Read 4 remaining paragraphs | Comments

Model mixes AI and physics to do global forecasts

Image of a dark blue flattened projection of the Earth, with lighter blue areas showing the circulation of the atmosphere.

Enlarge / Image of some of the atmospheric circulation seen during NeuralGCM runs. (credit: Google)

Right now, the world's best weather forecast model is a General Circulation Model, or GCM, put together by the European Center for Medium-Range Weather Forecasts. A GCM is in part based on code that calculates the physics of various atmospheric processes that we understand well. For a lot of the rest, GCMs rely on what's termed "parameterization," which attempts to use empirically determined relationships to approximate what's going on with processes where we don't fully understand the physics.

Lately, GCMs have faced some competition from machine-learning techniques, which train AI systems to recognize patterns in meteorological data and use those to predict the conditions that will result over the next few days. Their forecasts, however, tend to get a bit vague after more than a few days and can't deal with the sort of long-term factors that need to be considered when GCMs are used to study climate change.

On Monday, a team from Google's AI group and the European Centre for Medium-Range Weather Forecasts are announcing NeuralGCM, a system that mixes physics-based atmospheric circulation with AI parameterization of other meteorological influences. Neural GCM is computationally efficient and performs very well in weather forecast benchmarks. Strikingly, it can also produce reasonable-looking output for runs that cover decades, potentially allowing it to address some climate-relevant questions. While it can't handle a lot of what we use climate models for, there are some obvious routes for potential improvements.

Read 16 remaining paragraphs | Comments

The Earth heated up when its day was 22 hours long

The Earth heated up when its day was 22 hours long

Enlarge (credit: Roman Studio)

Because most things about Earth change so slowly, it's difficult to imagine them being any different in the past. But Earth's rotation has been slowing due to tidal interactions with the Moon, meaning that days were considerably shorter in the past. It's easy to think that a 22-hour day wouldn't be all that different, but that turns out not to be entirely true.

For example, some modeling has indicated that certain day lengths will be in resonance with other effects caused by the planet's rotation, which can potentially offset the drag caused by the tides. Now, a new paper looks at how these resonances could affect the climate. The results suggest that it would shift rain to occurring in the morning and evening while leaving midday skies largely cloud-free. The resulting Earth would be considerably warmer.

On the Lamb

We're all pretty familiar with the fact that the daytime Sun warms up the air. And those of us who remember high school chemistry will recall that a gas that is warmed will expand. So, it shouldn't be a surprise to hear that the Earth's atmosphere expands due to warming on its day side and contracts back again as it cools (these lag the daytime peak in sunlight). These differences provide something a bit like a handle that the gravitational pulls of the Sun and Moon can grab onto, exerting additional forces on the atmosphere. This complicated network of forces churns our atmosphere, helping shape the planet's weather.

Read 13 remaining paragraphs | Comments

Is a colonial-era drop in CO₂ tied to regrowing forests?

Image of a transparent disk against a blue background. The disk has lots of air bubbles embedded in it.

Enlarge / A slice through an ice core showing bubbles of trapped air. (credit: British Antarctic Survey)

Did the massive scale of death in the Americas following colonial contact in the 1500s affect atmospheric CO2 levels? That’s a question scientists have debated over the last 30 years, ever since they noticed a sharp drop in CO2 around the year 1610 in air preserved in Antarctic ice.

That drop in atmospheric CO2 levels is the only significant decline in recent millennia, and scientists suggested that it was caused by reforestation in the Americas, which resulted from their depopulation via pandemics unleashed by early European contact. It is so distinct that it was proposed as a candidate for the marker of the beginning of a new geological epoch—the “Anthropocene.”

But the record from that ice core, taken at Law Dome in East Antarctica, shows that CO2 starts declining a bit late to match European contact, and it plummets over just 90 years, which is too drastic for feasible rates of vegetation regrowth. A different ice core, drilled in the West Antarctic, showed a more gradual decline starting earlier, but lacked the fine detail of the Law Dome ice.

Read 30 remaining paragraphs | Comments

❌